End of Rotation Exam Scale Score FAQs
Starting with Version 6, End of Rotation™ exam scores will be reported on a scale from 300 to 500. Using this standard metric will allow for easy comparisons between versions of the exam over time and forms of the exam delivered to a cohort. A number of questions have been asked that deserve some detailed, written explanation. This FAQ series will evolve as faculty feedback comes in.
- Topic 1: What does it mean? The basics of scale scores
- Topic 2: What will it look like? Score reports and conversions
- Topic 3: What do students need to know? Interpreting and grading
- Topic 4: How do we make the transition? Checklist of steps
- Topic 5: The technical details
Here is your introduction to scale scores and what they mean for the End of Rotation exams.
Topic 1: What does it mean? The basics of scale scores
What are scale scores?
Moving forward, the scores for the PAEA End of Rotation exams will be reported as scale scores rather than as the number correct. Scale scores are scores that have been mathematically transformed from one set of numbers (i.e., the raw score) to another set of numbers (i.e., the scale score), in order to make them more comparable. Doing so allows for a single performance report per specialty exam. The primary benefit of scale scores is that it allows all scores on all versions and forms of the End of Rotation exams to be comparable across years and cohorts because they all use the same scale metric. While many theories can be used to determine scale scores, PAEA chose linear transformation of item response theory modeling.
Using the number correct score for fair comparisons of students’ performance on different forms of the same test is not ideal — the forms have different questions that may be slightly more or less difficult. To make consistent and fair decisions based on assessment results, the scores reported from different forms need to be comparable. As such, reporting scores using a scale score rather than a number correct score allows PA programs to do this more accurately. When looking at any individual specialty exam (i.e., Family Medicine or General Surgery), scores from forms within the same year and across years are comparable because they are reported on the same metric.
Once the scale scores are in place, can different specialty exam scores be compared?
Scale scoring allows scores from the same specialty exam to be compared between exam versions, forms, and cohorts. However, scores can only be compared within each specialty exam, not between specialty exams.
While you cannot directly compare total scale scores between specialty exams, you can look at subscores from similar content areas for program evaluation. Trends can be analyzed in content and task areas between exams for those areas that appear on multiple exams. For example, if subscores in endocrinology are consistently low across many of the End of Rotations exams, you may want to reflect back on your curriculum and determine if endocrinology is covered in sufficient detail during the didactic phase of the program. This provides valuable data to ensure your program is meeting its objectives.
Topic 2: What will it look like? Score reports and conversions
What will the score reports look like?
The score reports will look very similar to the reports members currently access on ExamDriver. There will be an individual student performance report, a program-level performance report, and a program-level composite Excel spreadsheet.
The cohort composite report. The composite report will look almost identical to the current one. The main difference is that you will now see scale scores instead of raw scores for Version 6 and later. Version 6 will appear on a separate Excel worksheet from earlier exam versions in order to separate exams that are given a raw score from exams that are given a scale score. These are denoted by exam administration date (arrow A in the image below). We will still display the form numbers of each exam so that you can be sure students are seeing a different exam if they are retested (arrow B in the image below).
Here is an example of the cohort composite report:

For most of the exams, the key is the same. Things get a little more complicated for the Psychiatry and Behavioral Health exams. Since we changed the blueprint with Version 4 to be compliant with DSM-5, we had to add an additional set of tabs. So now, there will be third Class Scores tab (arrow A in the image below). The second key applies to both later tabs.

The program performance report. Moving to a scale score means the forms on each specialty exam are equated, so we will no longer need to provide program-level performance reports for each individual form — which is an exciting enhancement. From now on, you will only see one performance report for each exam version. In other words, where you saw FMEOR v5.1 and v5.2 performance reports before, you will only see FMEOR v6 moving forward. The main difference you will notice, other than the scores, is in the title of the columns (arrow A in the image below) moving from % Correct to Average Score and National Average. Also, the Number of Exams ticker (arrow B in the image below) will move up a little faster because it includes both forms.
Here is an example of the new program performance report:

The report shows the average score for all students in the class, as well as the national statistics for students from all programs who have answered these questions in previous versions.
There is a new disclaimer at the bottom of the report that clarifies the parameters of the scale and the national reference population used to create the national average. It states:
Comparative data contained in both the class average table at the top of the report and the “Content Area Feedback” sections are based on a reference population of test takers. The value listed in the “Class of <class name from ExamDriver> Average Score” column reflects your cohort’s performance on the test questions in each content area. Like the total score, your program’s performance ranges from 300 to 500.
The “All PROGRAMS National Average” column is comparative data. The score in this column is the average score of a reference population of test takers from all PA education programs on items in each content area on the <specialty of the exam> End of Rotation examination. The information provided in the last column is provided as a point of reference so you can compare your cohort’s performance to national performance.
For guidance on how to interpret the results, please visit EndofRotation.org.
The student performance report. The student performance report will look similar to the previous reports, but with a new way to display overall score and different subheadings. It will give the student’s total scale score at the top on a visual performance bar (arrow A in the image below). Next, content area and task area feedback will be reported with the student’s scale score and the national average score (arrow B in the image below). As with previous student reports, keyword feedback will be at the bottom of the page (not shown — it didn’t change).
Here is an example of the new student report: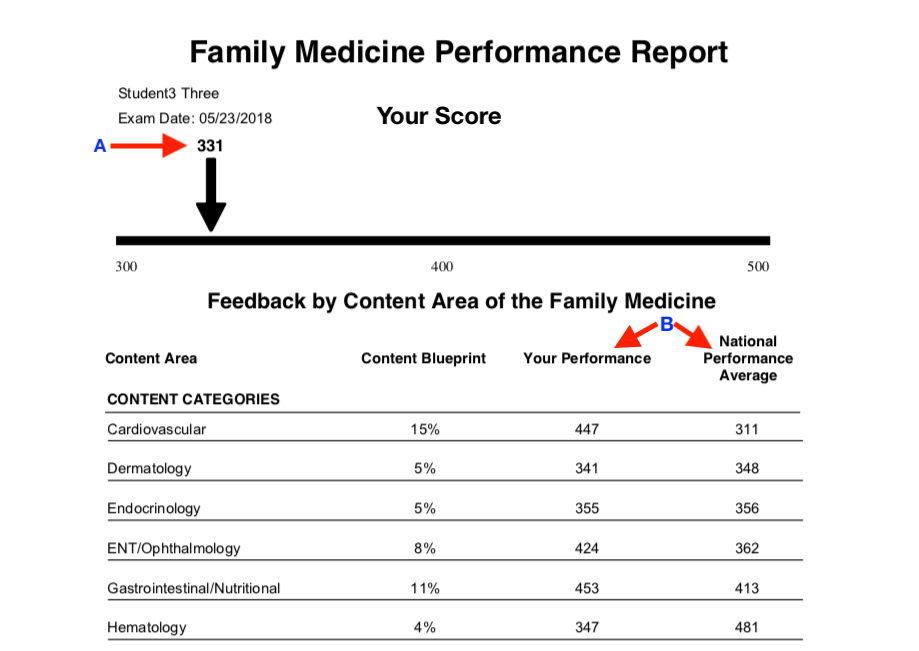
There is a new disclaimer at the bottom of the report that clarifies the parameters of the scale and the national reference population used to create the national average in the content area section. It states:
The comparative data in the “Feedback by Content Area” section are based on a reference population of test takers. The listed percentages in the “Content Blueprint” column reflect the percentage of questions targeted for inclusion on each exam form; however, the actual content percentage on your test form may vary slightly from this target.
The number listed in the “Your Performance” column reflects your performance on the test questions in each content area. Like the total score, your performance in each content area ranges from 300 to 500.
The “National Performance Average” column is comparative data. The score in this column is the average score of a reference population of test takers from all PA education programs on items in each content area on the <specialty of the exam> End of Rotation examination. The information provided in the last column is provided as a point of reference so you can compare your performance to your peers.
What does the conversion tool look like?
To make the enhancement to scale scores as seamless as possible, an online conversion application is available in ExamDriver. The conversion tool is similar to conversion calculators available on other apps, such as those that are commonly used to calculate body mass index and medication dosages. The scale score from the student report or composite report can be entered into a column, and the raw score will be computed, and vice versa. The conversion tool is available to faculty only in ExamDriver, using a link in the upper right corner of the Reports tab.
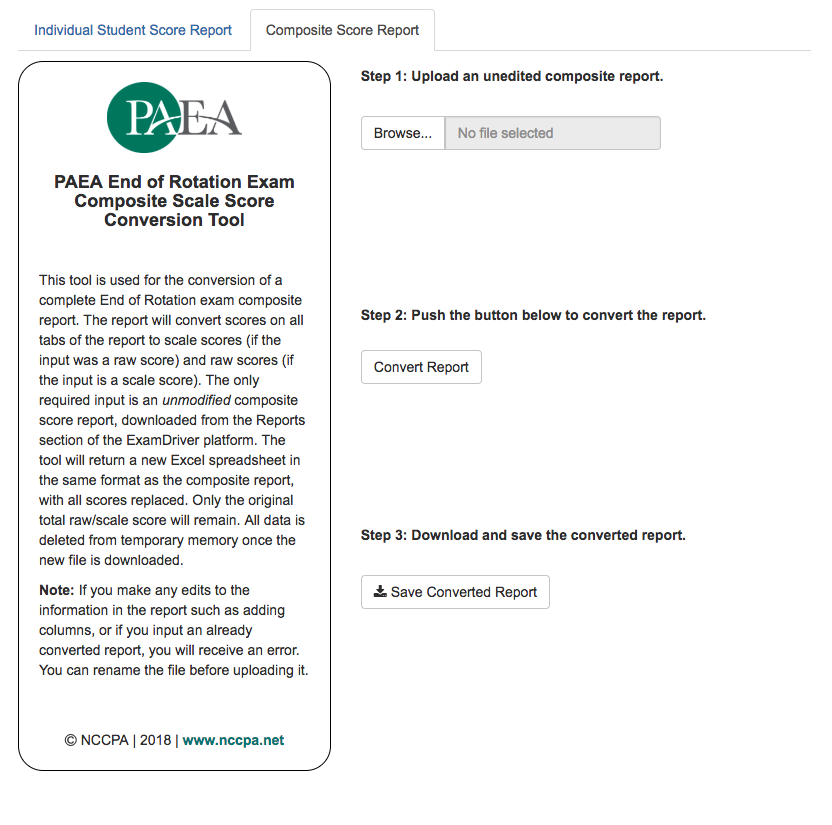
Here is what the student score report conversion tool looks like:

As you can see from the above screen shot, you will be able to select the specialty exam (arrow A), version of the exam (arrow B), and exam form (arrow C), and covert the raw number to a scale score by entering the data as they appear on the score report starting with the total correct (arrow D). It also works in reverse: programs that are deep into their clinical year and need to continue providing raw scores will be able to look up those scores as well. Based on your feedback, we are also currently investigating mass conversion options for these programs. We intend to have this available in the next month.
On August 14, we released a Composite Score Report conversion tool that converts an entire cohort’s scores at one time. This tool also works both ways when you upload any unedited composite score report. Just follow the simple steps in the tool to retrieve converted scores.
If I enter the national comparison data into the conversion tool, why do I get a different value compared to the means that are published? Or, why does it say ‘can’t find a score on the lookup table’?
If you were to enter the projected raw mean for Version 6 Emergency Medicine (mean of V6.1= 77.41 and V6.2= 77.11) to determine a mean scale score, it would be different than the mean scale score that is currently displayed on the website.
Likewise, in reverse, if you were to enter the projected scale score mean for Version 6 Emergency Medicine (mean V6 = 406) to determine a mean raw score, it would also be different than the current mean raw scores that are displayed on the website.
While this may seem confusing, this is not a flaw in the tool; the tool is actually working correctly. The tool is meant to convert a single student’s scores and subscores, not average scores. Converting a program’s average raw score would tell us what scale score a student who had attained that average raw score would receive. It would not tell us the average scale score for the program. The best way to compute an average scale score is to average the scale scores of the students in a given cohort.
This happens for a few reasons: raw scores are skewed and — in the case of PAEA End of Rotation exams — there are 100 questions, and most students score between 50–90. Scale scores try to eliminate this skew by stretching out values over 200 integers. Since the scale score metric ranges from 300–500 (200 points) and test forms only contain 100 items, there will not be a raw score for each possible scale score. There will be exactly one scale score for each individual raw score.
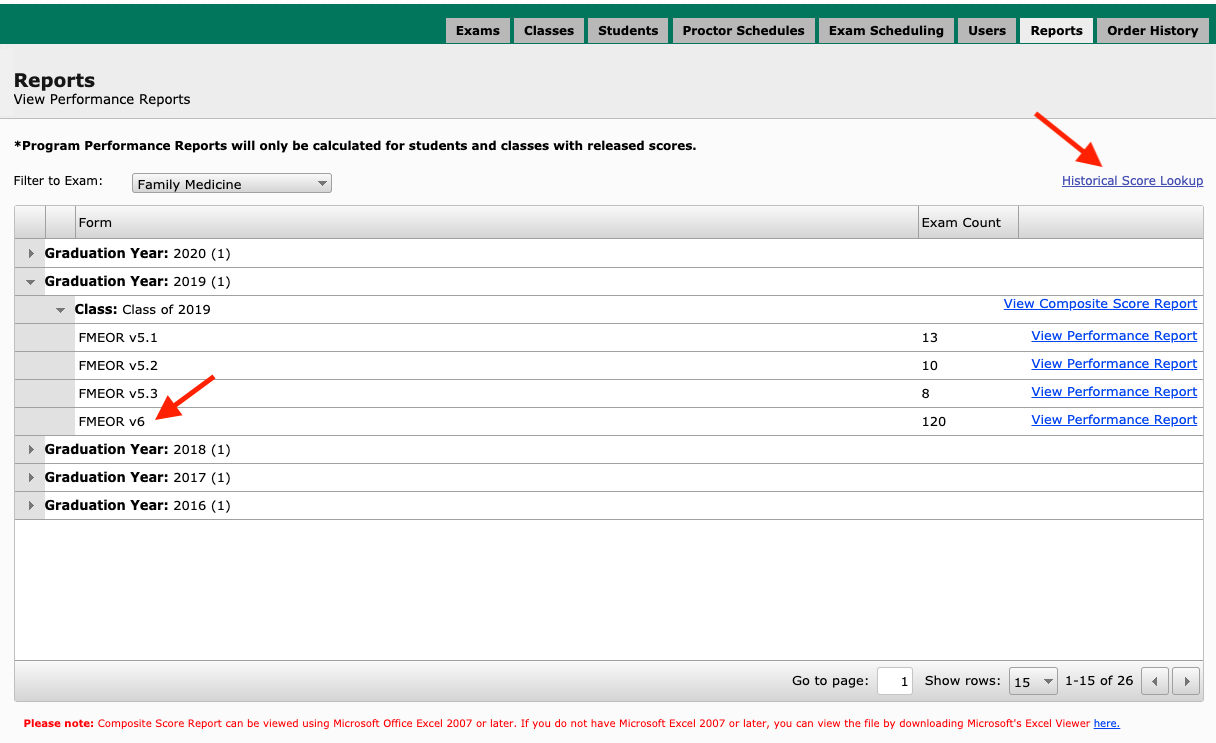
Does the enhancement change what the Reports tab will look like?
The reports tab will look slightly different moving forward. When you select an End of Rotation exam from the Filter to Exam dropdown, a little link will appear on the right side called Historical Score Lookup. This link will take you to the score conversion tool. Also, you’ll only see one performance report for all Version 6 exams rather than two.
Topic 3: What do students need to know? Interpreting and grading
What are some practices for converting scale scores into letter grades?
As PAEA transitions the End of Rotation exams to scale scores, many programs have questions about how to convert scale scores to grades. As has always been the case, it is important to reiterate that PAEA does not set standards for End of Rotation exams, nor do we advise programs on setting their own performance bars or passing score requirements. Additionally, the national mean score of any PAEA End of Rotation exam does not suggest a pass bar. These need to be established at the program level.
In making this change, our goal is to help programs understand how to use scale scores to make informed decisions about student performance. The following are a few general considerations and some methodological guidance to help programs determine how to convert a scale score into a letter grade.
Similar to when the PAEA End of Rotation exams were first introduced and programs had to determine performance bars or passing scores, the scale score enhancement requires that program faculty determine how to translate scale scores into grades. Depending on the program, this may be pass/fail or letter grades. PAEA End of Rotation raw scores range from 0 to 100, making it appear relatively easy to transfer raw scores into percentages and thus letter grades. But even when 0 to 100 raw scores were reported, a raw score of 80 did not translate to “80%” for every program. PA programs have used a number of different techniques including z-scores, cohort-level means and standard deviations, as well as program trends over time, to determine performance bars and passing score requirements that fit their program’s grading scale.
With the transition to scale scores, student scores on End of Rotation exams will now range from 300–500, which is significantly different from a raw score. However, the process of translating that scale score to a grade should follow the same principles that were used when translating a raw score of 0–100 to a grade.
KEY CONCEPTS
A unified scale eliminates differences between forms. PAEA transitioned to scale scores to remove small differences in difficulty between exam forms. We do not recommend using the conversion tool to revert the scale score back to a raw score for purposes of assigning a grade. Not only is this a cumbersome extra step, but it also reintroduces differences in difficulty between forms that scale scores eliminate.
Bell-shaped curves. It is important to remember that only the score metric has changed. Scores will still follow the same bell-shaped curve, with means and standard deviations. For example, see the following classic histogram of model-based performance data for the soon-to-be-released Emergency Medicine End of Rotation exam, Version 6:

Consistency is important. No matter which method your program chooses to convert the scale score into a grade, we encourage you to maintain consistency with practices you have followed in the past. As a starting point, look to how your program has historically set performance bars, passing scores, and grades.
A single decision point allows programs to make the strongest determination. When considering performance bars and passing scores, programs can make the strongest, most defensible statement about a student’s performance by setting just one pass/fail bar. The more performance bars set, the more difficult it is to differentiate student performance. For example:
- Programs can make the most reliable determinations about student performance if they set one performance bar. The grouping of all the students who passed or failed the exam into two categories, regardless of their exact score, is both fair and defensible. This clearly differentiates students who have appropriate knowledge (they passed) from those who have significant knowledge deficits (they failed).
- Programs can make reasonable determinations about student performance if they set a few performance bands, i.e., setting scoring quartiles or ranges. Looking at a traditional grading scale, we can say that all students who score between 90–100% are high achievers. The grouping of students into defined performance bands can stratify students into performance categories and is also fair and defensible.
- It becomes risky, however, to differentiate students in small range performance bands or point-by-point. Using that traditional grading scale as an example, we cannot make meaningful determinations about the difference between two students who scored a 94% and 95% on an exam.
SAMPLE PRACTICES
We encourage program faculty to meet, discuss, and agree upon the following:
- Performance bars and/or passing scores for the new scale score metric that are best for your program, as well as the rationale for those choices so you can defend the grades, if necessary (i.e., in the setting of an academic action)
- The method your program will use to convert scale scores to recordable grades
- Which student policies need to be updated, as well as how and when those updates will be communicated
The options below are presented to provide considerations and methodological guidance. This guidance will help your program consider overall supervised clinical practice experience (SCPE) and/or course grades in the context of how to convert scale scores to best meet your grading criteria. This list is not all-inclusive, and order does not indicate an endorsement or preference.
Pass/Fail
Pass/fail — compensatory. In this model, programs use the PAEA End of Rotation exams as a pass/fail exam, setting a single pass bar. If a student passes the exam, a specific point value will be assigned that contributes to the overall course or SCPE grade. If a student fails the exam, it is associated with a lower point value that contributes to their overall grade. This is called the compensatory model because it allows students who fail a PAEA End of Rotation exam to “compensate” and still potentially receive a passing course or SCPE grade if they were strong in other graded areas (i.e., preceptor evaluation, OSCE, or other course assignments). Remediation, if required by the program, should be considered for students who do not achieve a passing grade.
Pass/fail — non-compensatory. Also known as pass/fail — conjunctive hurdle. In this model, programs also use the PAEA End of Rotation exams as a pass/fail exam, setting a single pass bar. However, a student cannot fail the exam and still pass the course or SCPE. It’s called a conjunctive hurdle because students are required to pass multiple hurdles to pass the course or SCPE. They must pass the exam and get a passing course grade that is made up of other required course components. In this model, the PAEA End of Rotation exams become a standard for progression.
Letter Grades
Percentage-based performance bands. In this model, programs convert a scale score range to percentage-based performance bands, choose a single mid-point for each band, and assign that mid-point as a grade. Any student who performed within that range would be assigned the same percentage-based grade. For example, your program may decide that a scale score range of 400–450 converts to 80–90% and that all students falling in this performance band are assigned an 85% as an exam grade. That 85% then becomes a single component of the course, or SCPE grade. With this model, students may be frustrated if their score was on the higher end of the band, but they were still assigned an 85%. However, we know that it’s difficult to make any substantial determinations about the difference in knowledge between a student who got an 85% versus an 89%, making this model defensible. This model is similar to the way the assignment of final letter grades works at many institutions. An A grade may equate to any grade of 93–100%. The A is recorded on the transcript, not the specific percentage. If more precision is required, smaller bands can be developed. Students can further distinguish themselves via other components of the overall evaluation. It’s important to note that programs should not convert the scale score back to a raw number to implement this model. The correct way to implement this model is to look at the scale score means and standard deviations and set scoring ranges that can be converted to percentage-based performance bands.
Z-score. Using the z-score model is, in essence, applying a second scale to the PAEA scale score — it may be a reasonable option for programs, especially those programs already using the z-score. We can use the example provided above (PAEA Emergency Medicine End of Rotation exam, Version 6) where the mean scale score is 402.99 and the standard deviation is 22.55, and then calculate a z-score for a hypothetical test score of 450:

The student has a z-score that is 2.08 standard deviations above the mean. Refer to a statistics textbook or online program for a z-table.
Note: All of these models should only be applied to total scores, not subscale scores. Trying to convert subscales for an individual student in a small content area to an alternative metric limits your ability to make meaningful inferences or determinations.
What have programs done to manage the change to scale scores?
Three programs describe their analysis, decision-making, and communication processes to PAEA in the form of short interviews. Read their stories here.
How can we help communicate the changes to the students?
Once these decisions have been made, programs will need to determine which student policies need to be updated, as well as how and when those updates will be communicated to students. Programs that experience this change during a clinical year, particularly toward the beginning of the clinical year, may want to create a policy revision (addendum) that is provided to students in writing. Other programs near the end of the clinical year may simply want to use the raw score conversion tool to create raw scores for the final few rotations and not change their policy for the current class. Either way, changes should be communicated in course or SCPE syllabi and in appropriate handbooks or other places where policies may be outlined. In addition to making formal policy updates, programs should be prepared to introduce the scale score to students in-person — perhaps during a call back and/or during faculty advisor meetings. Ideally, this should be done before releasing grades for the first scale-score exam.
Explaining to students that only the score metric has changed is imperative. A student and program can still use the national comparative data along with keyword feedback to help develop an individually tailored remediation or study plan. As always, students should be cautioned against over-interpreting sub-scores, because while a student may have achieved a perfect score in an individual content area, it’s possible there were only three questions in that section.
The release of scale scores for PAEA End of Rotation exams represents an important enhancement that removes small differences in difficulty between exam forms. This shift may change the way grade calculations are done in programs using PAEA End of Rotation exam scores. Faculty should discuss the various options for assignment of course and SCPE grades and determine what makes the most sense for the program. This decision then should be communicated to students through policy updates and student meetings.
Topic 4: How do we make the transition? Checklist of steps
What steps should I take to prepare for the transition?
We have compiled this checklist of considerations in advance to help you prepare for the upcoming enhancement. While the process may differ from institution to institution, the general components are the same.
Step 1 – Converting scale scores into letter grades
Meet, discuss, and agree upon the following:
| ▢ | Performance bars and/or passing scores for the new scale score metric that are best for your program, as well as the rationale for those choices so you can defend the grades if necessary (i.e., in the setting of an academic action). |
| ▢ | The method your program will use to convert scale scores to recordable grades — these FAQ items will help. |
| If you need to continue using raw scores to finish out a cohort in the middle of their clinical training, a few conversion processes will need to happen: | |
| ▢ | Determine who will convert student scale scores to raw scores. |
| ▢ | Ensure this person/team have access to scores and the Conversion Tool through the Reports tab. This person/team must be assigned as a Faculty user in ExamDriver. Instructions for accessing the tool are here. |
| ▢ | Establish a time frame to share grades with students. (You can still release results right away, but they will be reported on the 300–500 scale.) |
Step 2 – Updating policies
| ▢ | Determine which student policies need to be updated, as well as how and when those updates will be communicated to students. You will likely need to update the policy in your student handbook, SCPE syllabi, or other places where policies or grading scales may be communicated. |
| ▢ | Make sure you remove distinctions between the forms on scale score reporting. We are only reporting one set of comparative statistics since the scale equates the forms (i.e., instead of reporting Family Medicine, Version 6.1, 6.2, and 6.3, we will now only report Family Medicine, Version 6). |
Step 3 – Communicating changes
| ▢ | Ensure all faculty and staff working with clinical-year students know about the change. |
| ▢ | Ensure the leadership knows about the change. |
| ▢ | Ensure the students know about the change. |
| ▢ | Ensure PAEA knows about any issues that arise from implementing the change (email us at exams@PAEAonline.org). |
Though this conversion is a significant change, scale scores are the strongest methodological way to evaluate students on exams with multiple forms that change year-over-year. Equating forms onto a single metric allows you to make more robust determinations about student performance and program performance over time. If you get stuck on any part of this process, please reach out to us so we can help you understand potential solutions.
Topic 5: The technical details
What process did you use to determine the scale scores?
Our psychometric team analyzed End of Rotation exam performance data following best statistical practices and presented the results to the PAEA Assessment team. The final process to determine the scale scores was a linear transformation of item response theory (IRT) scores.
What did you use as the mean to determine the scale scores, and why?
The statistical analysis of the means and equating of scale scores was completed by our psychometricians. PAEA used two primary criteria to select the best option: 1) the mean used should best represent a normally distributed base sample, and 2) the sample should be most representative of the current student population. The mean that was selected to determine the scale score was the mean score across the most recent year of complete data for each End of Rotation exam. These data provide an even distribution of scores and is the most recent representative picture of our current student population.
This standard will be reviewed every three to five years per best psychometric practices.
In what increments will scores be reported?
To allow for the greatest precision of scores, one-point increments are used for the scale scores.
Does the equalization normalize raw scores into scale scores, or can we still see non-normal distributions in scale scores?
Scale scoring creates a fixed center point and, due to the large number of national student test-takers, the national distribution is normalized. However, scale scoring will not get rid of score differences within individual programs, if they exist. Scale scoring will not eliminate uneven distributions of both high and low scores, depending on the variation in your program.
How are the national comparative data available on the first day of administration calculated?
Since publication of Version 2 of the End of Rotation exams, PAEA has provided members with projected national comparative data (means and standard deviations) on the first day of administration. These comparative data were based on the projected performance of a reference population of PA students and the historical performance of individual items included on the new forms. When the exam was retired in mid-July, we then were able to report the final statistics for that version of the exam. The projected mean and standard deviations were extremely close to the final numbers that were reported.
For Version 6 scale scores, the method we used to make national comparative data available on the first day of administration is different than the historical method described above. Scale scores are developed based on actual performance of a reference population of students taking Version 5 End of Rotation exam forms. For example, the final data from Version 5 of each of the specialty exams were statistically equated to scale scores using a linear transformation. Utilizing empirical versus projected data in statistical analysis yields slightly different results, but ensures that data are stable across years. To best represent our student test-takers, we felt it was important to transform raw scores into scale scores using empirical data.
We have provided you with Version 6 projected raw scores and standard deviations. Additionally, we have reported the mean scale scores and standard deviations for program comparison. When you look at this data, it must again be emphasized that the comparative scale scores were developed from Version 5 means.